TDC:Data Visualisation
In this data visualization task, I created two charts to illustrate my weekly routine. I chose study time and sleep time because these are also related to my daily life. Although the data volume is not large, I believe there are certain patterns. Presenting the data in a table format would be rather bland. Converting it to charts makes it easier for me to make statistical analyses and adjustments.
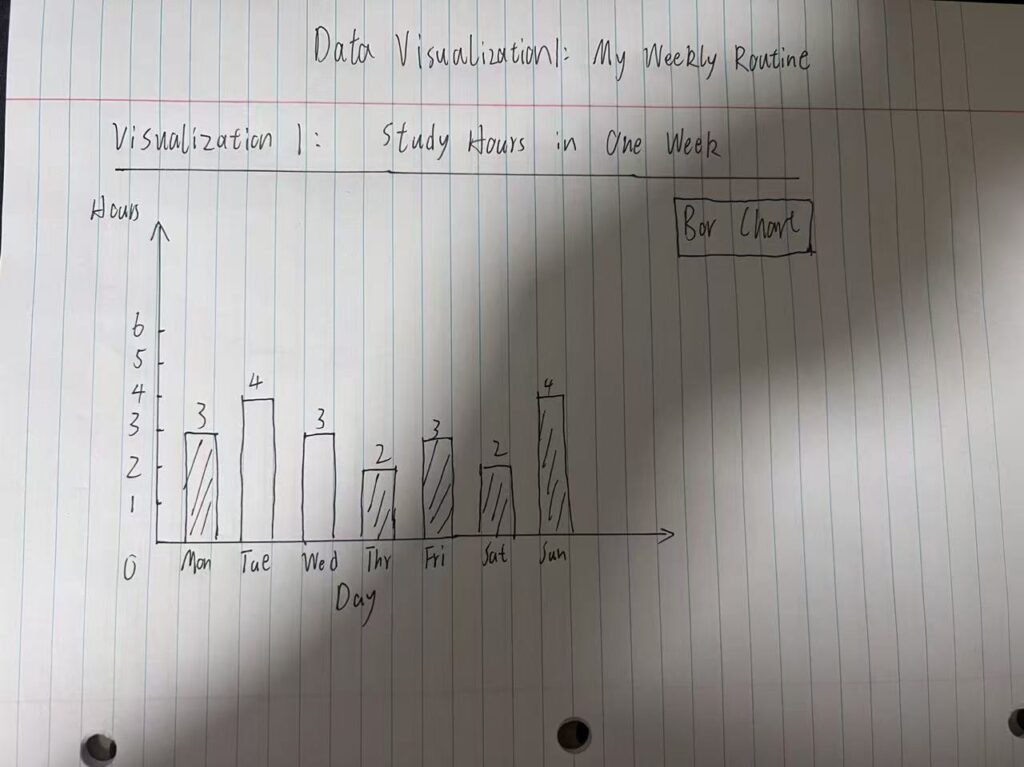
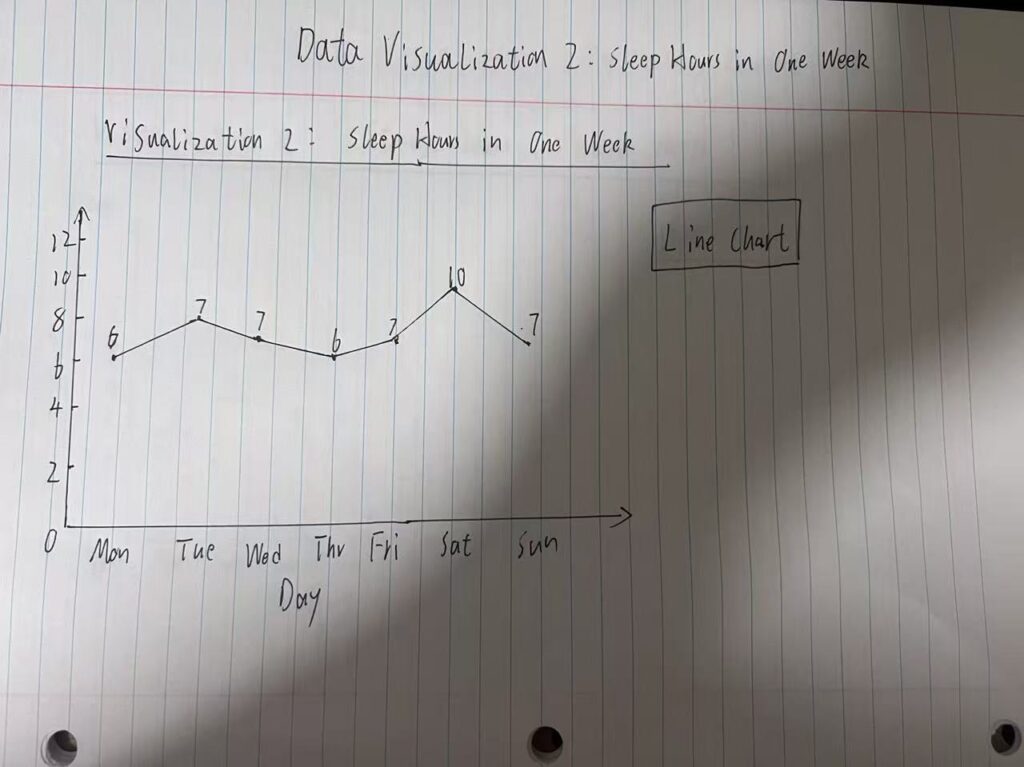
The first chart is a bar chart showing weekly study time. I chose a bar chart because I wanted to clearly compare daily data. For example, I can clearly see which days I studied longer and which days I studied shorter. This is much more convenient than reading the numbers one by one. The second chart is a line chart showing weekly sleep time. I chose a line chart because weekly sleep time varies. This chart makes it easy to see how daily sleep time fluctuates. I can see that my sleep time is sometimes long and sometimes short, with one day I slept much more than other days.
I used the principle of consistency to keep the charts concise and clear. I didn’t add too much decoration or extra information to the page to avoid affecting readability. Each chart only covers one element. Secondly, I used the proximity principle, placing the charts and their captions together to aid my understanding. Finally, I used the separation principle, separating the study chart and the sleep chart. I found that creating two independent charts made the purpose of each visualization clearer.
These two images made me realize how convenient hand-drawn charts are. I can make adjustments to my weekly schedule as needed.